
In the previous article of this series, I've described how to setup a SonarQube to begin with the static code analysis for your project. It was enough for the start, but it was missing something. It was missing code coverage reports and stats. Of course, I'm talking when you are starting a new maven project like it was in my case.
Sonar will recognize tests, but it won't show them without proper report files. It will detect that you have test but it will be blind about test coverage
"I do have 3 unit tests, and SonarQube detects them, which is nice. However, I remember there has to be some SonarQube plugins activated (or configured) so it can detect line coverage. As you can see it's 0.0% at the moment, which I know it's not correct."
from previous blogpost
JaCoCo to the rescue
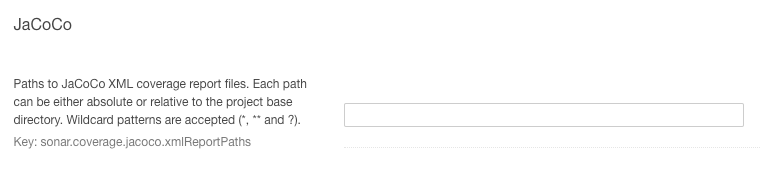
SonarQube works with JaCoCo reports. It searches for the jacocoTestReport.xml file. You don't have to do anything regarding that, it will search at the default location.
[INFO] 'sonar.coverage.jacoco.xmlReportPaths' is not defined.
Using default locations: target/site/jacoco/jacoco.xml,target/site/jacoco-it/jacoco.xml,build/reports/jacoco/test/jacocoTestReport.xml
In case that you do need to use different jacoco report file, you can set it up on the SonarQube project.
So, the next step is to add JaCoCo plugin to our pom file. But, there's a "catch". SonarQube need to report files to read the data from, but mvn install won't create it. You could spin up dedicated JaCoCo mvn command to create coverage report but that's boring and you don't want to do that every time. Instead, you can attach the report goal of the JaCoCo plugin to the maven test phase. Next time when you execute mvn install, which will also do a test phase, this plugin will be triggered and you'll get your reports generated. The plugin in pom file looks like this.
    <plugins>
         <plugin>
                <groupId>org.jacoco</groupId>
                <artifactId>jacoco-maven-plugin</artifactId>
                <version>0.8.6</version>
                <executions>
                    <execution>
                        <goals>
                            <goal>prepare-agent</goal>
                        </goals>
                    </execution>
                    <execution>
                        <id>report</id>
                        <phase>test</phase>
                        <goals>
                            <goal>report</goal>
                        </goals>
                    </execution>
                </executions>
            </plugin>
        </plugins>
To confirm that you have coverage reports generated, run mvn install and check out your target directory. You should have target/sites/jacoco/* there.
It's available as HTML too
Before we check how it looks like in the SonarQube, let me tell you this data is already available as HTML. Check out target/sites/jacoco/index.html. Open it in your browser and you should have something like this.
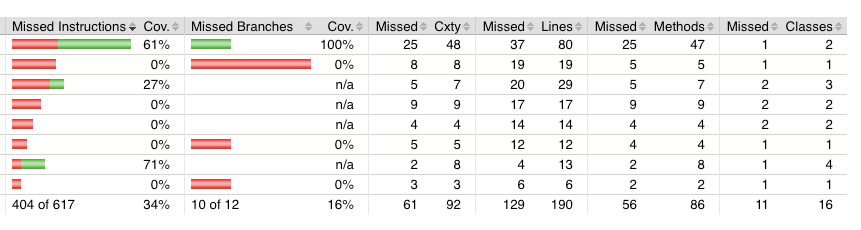
Actually, this is part of the table, in the first column you even have names of java packages and even classes if you go deeper. Check it out. You can even go so deep that you actually open a method in a class and see the coverage.
But, I won't be focusing on HTML view, let's move to the SonarQube, since there you will have historical data, after every scan, so you can track if your total coverage is rising, falling etc.
SonarQube coverage overview
First thing we noticed now is that quality gate marked our project as FAILED. By default, you need to have 80% covered code. Our example have slightly above 12%. Pay attention that this refers to the new code you submitted for the scan.
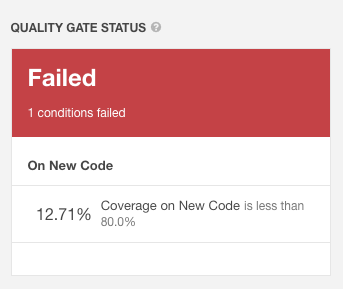
A Quality Gate is a set of measure-based Boolean conditions. It helps you know immediately whether your project is production-ready. If your current status is not Passed, you'll see which measures caused the problem and the values required to pass.
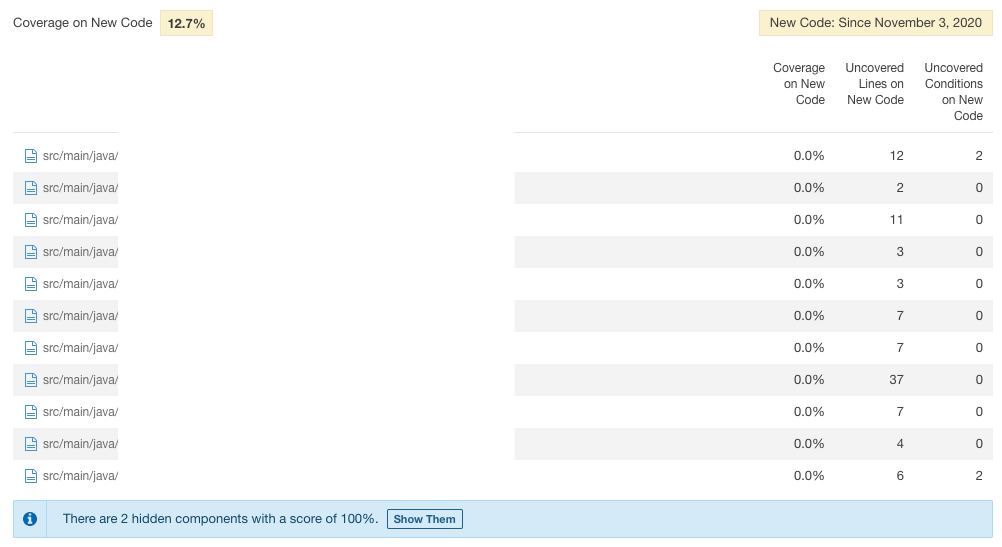
The HTML table we saw before is available in SonarQube as well. What we have here is the so called historical data. What you see above is the report from the last time we performed the scan. So it gives us the overview which new classes we pushed (if you're running the analysis in some CI/CD environment) that don't have test coverage.
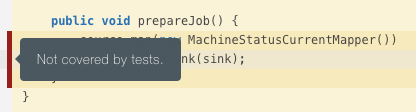
There is this visual indication that lines of code are missing test coverage. This can come in handy especially if you have some if statement. These tools can visually indicate if you forgot to test some of the conditions.
New vs Overall code report
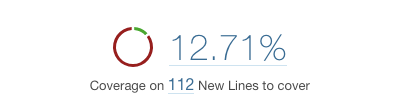
This is a percentage of new code that is submitted for the analysis. 12.71% and no test submitted. Guilty as charged.
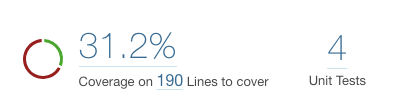
Here's the overall code coverage. 31.2% and 4 unit tests. Not great, not terrible. What I want to point here is that only the new code percentage will be checked against this 80% quality gate.
This means whatever new you commit, you should cover it with more than 80%. It won't keep punishing you (make your project FAILED) if your overall coverage is below 80%. Only the new code. But, with new code coverage, you'll raise overall one eventually.
Summary
To enable code coverage and make it visible in SonarQube, you need to setup a maven plugin JaCoCo. You also need to attach it to mvn test phase. Quality gate is checking if your freshly scanned code meeds the quality standards.
Now, this is line coverage, I have some thoughts on whether a line coverage is good indicator or not, but that's a topic for another blogpost.
Comments
Join the discussionFantastic. After 2 days looking how I could generate the directory target/site/jacoco/ with the file jacoco.xml, I found with this basic and perfect tutorial. Thanks so much.
Just do not forget to run mvn install (with test), otherwise the directory is not generated.
Alexandre da Silva thanks for your comments! This is the second post in my sonarqube series, in the next one, there's already some automation mentioned, so mvn install and similar things are included!
I'm glad you liked the tutorial style!
SonarQube
In this series I'll explain everything you need to start a SonarQube static analysis of your code


